| Info |
|---|
Expand each KPI to view more details |
| Expand | ||
|---|---|---|
| ||
This KPI brings out the execution statistics on all Github Actions, along with including the stage-wise totals. The Base KPI has 3 data blocks:
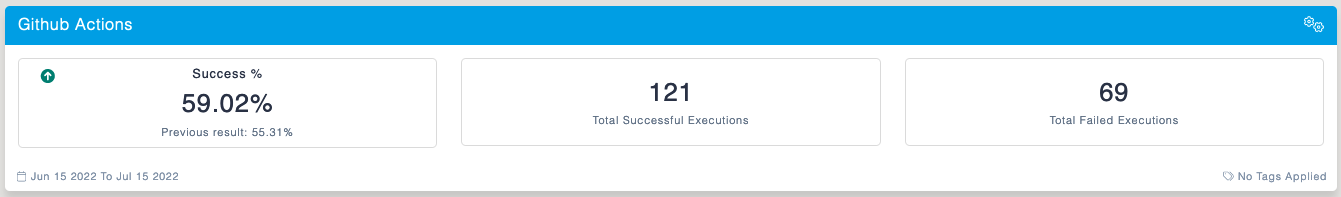 Drill Down Reports: Each data block has its own drill down capabilities. Success % : Shows the percentage of workflows split by various events, success/failed/cancelled/skipped. 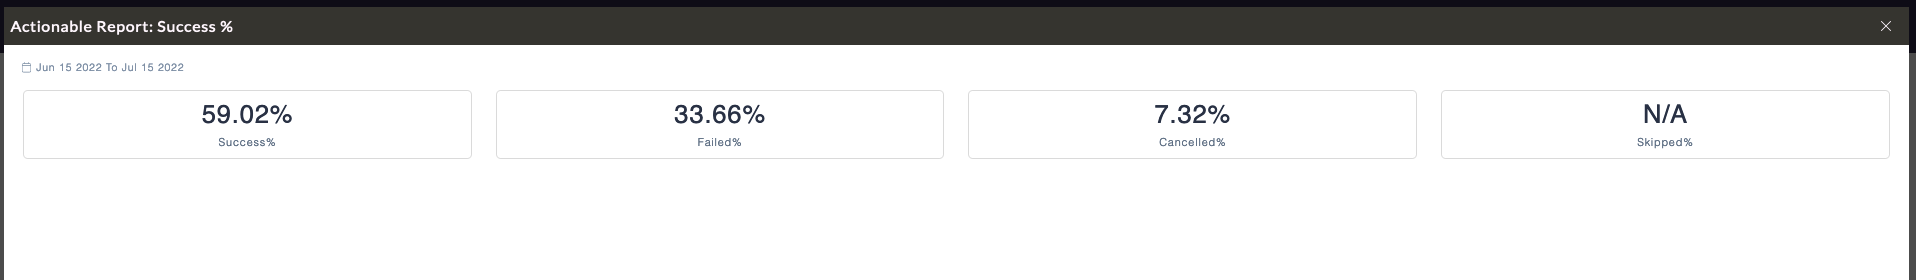 Total Successful Executions : Detailed drill down report on all the successful executions of each workflows, along with a summary that splits the count based on various critical stages in a workflow. The summarized view above shows the total count at various stages, and right below is a table view with a list of application names, and its corresponding list of executions in detail. 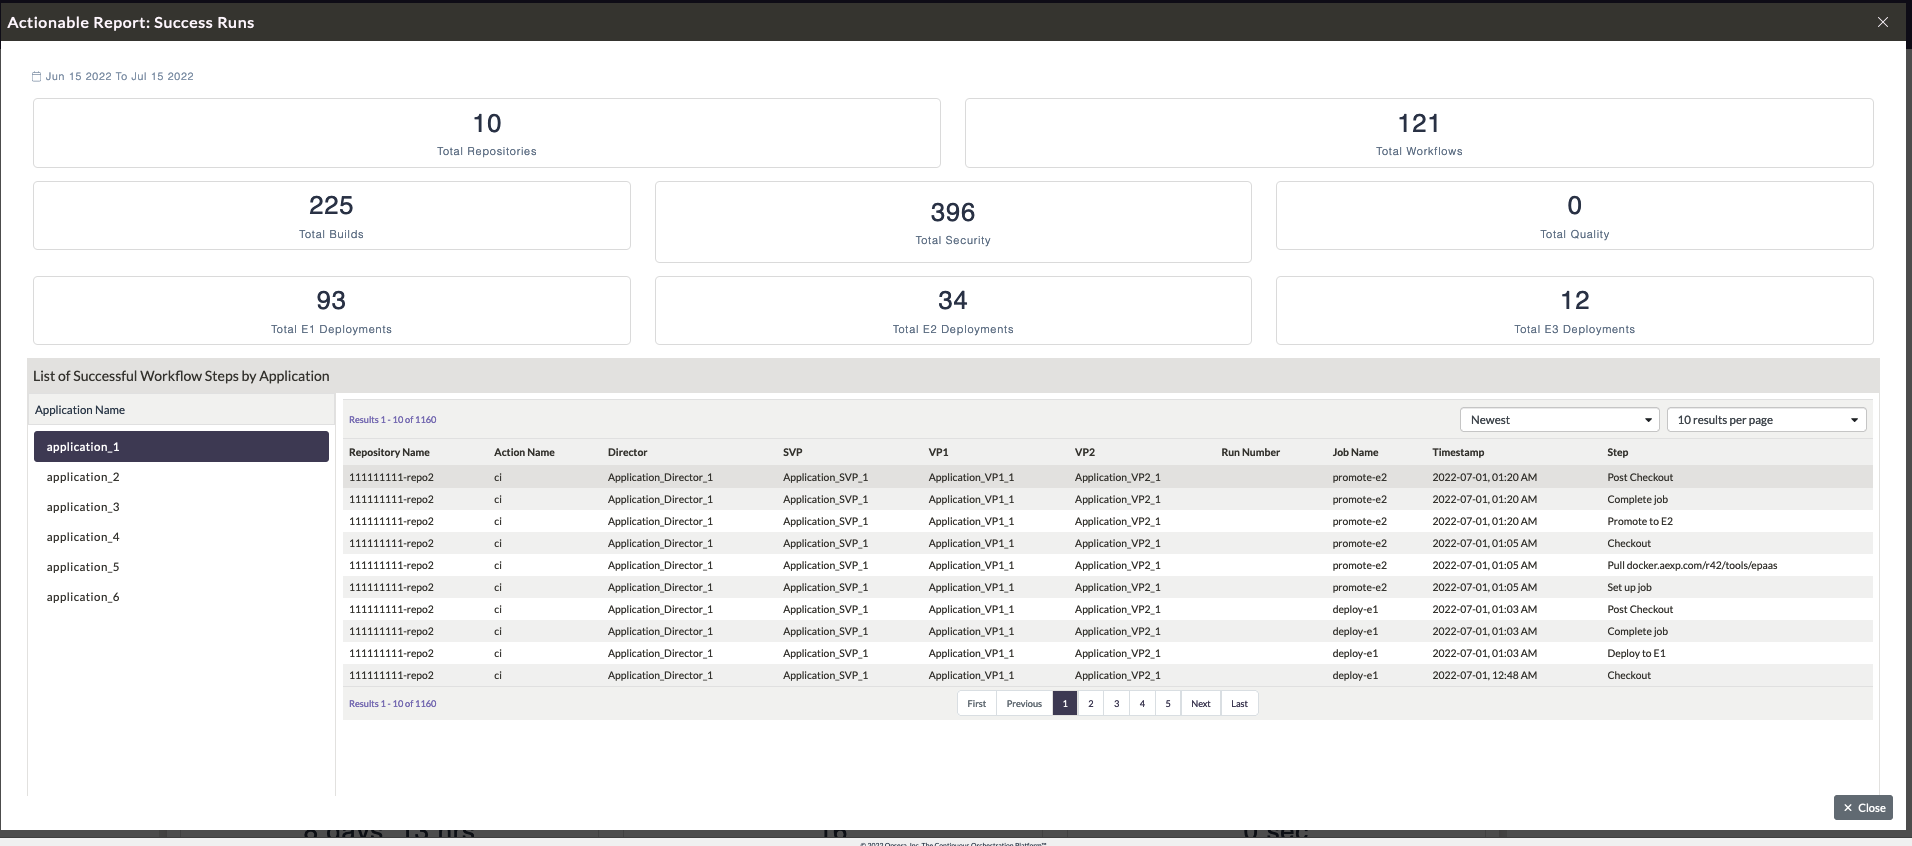 Total Failed Executions : Detailed drill down report on all failed executions of each workflows, along with a summary view. The summarized values adheres to the failed counts at all stages of the workflows, followed by a list of applications with its corresponding list of executions and the point of failure. Each workflow execution can be clicked to see the head commit details, in order to trace back to the list of commits made to trigger this workflow action. |
...