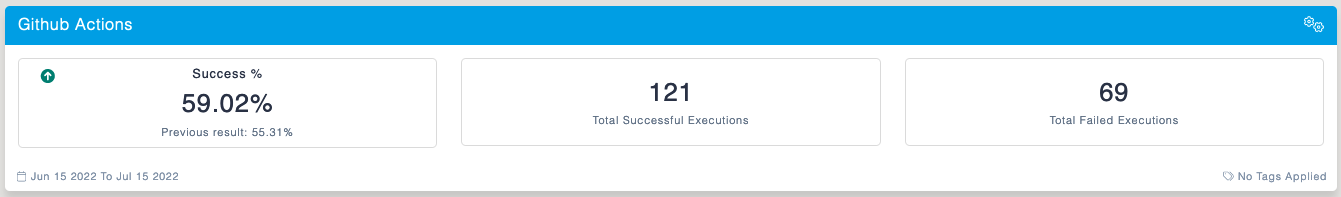
This KPI brings out the execution statistics on all Github Actions, along with including the stage-wise totals.
The Base KPI has 3 data blocks:
Success % : Denotes the percentage of workflows that have succeeded. The datablock has a trend that shows the comparison based on the previous time range, along with the previous results equal to the time range.
Total Success Executions : Total number of successful workflows being executed within a defined time range.
Total Failed Executions : Total number of failed workflows within a defined time range.
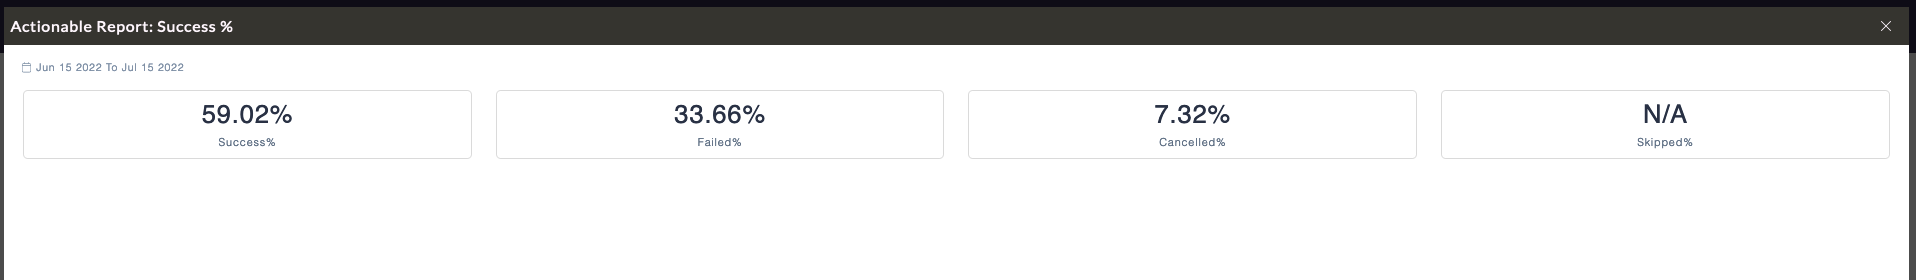
Drill Down Reports:
Each data block has its own drill down capabilities.
Success % : Shows the percentage of workflows split by various events, success/failed/cancelled/skipped.
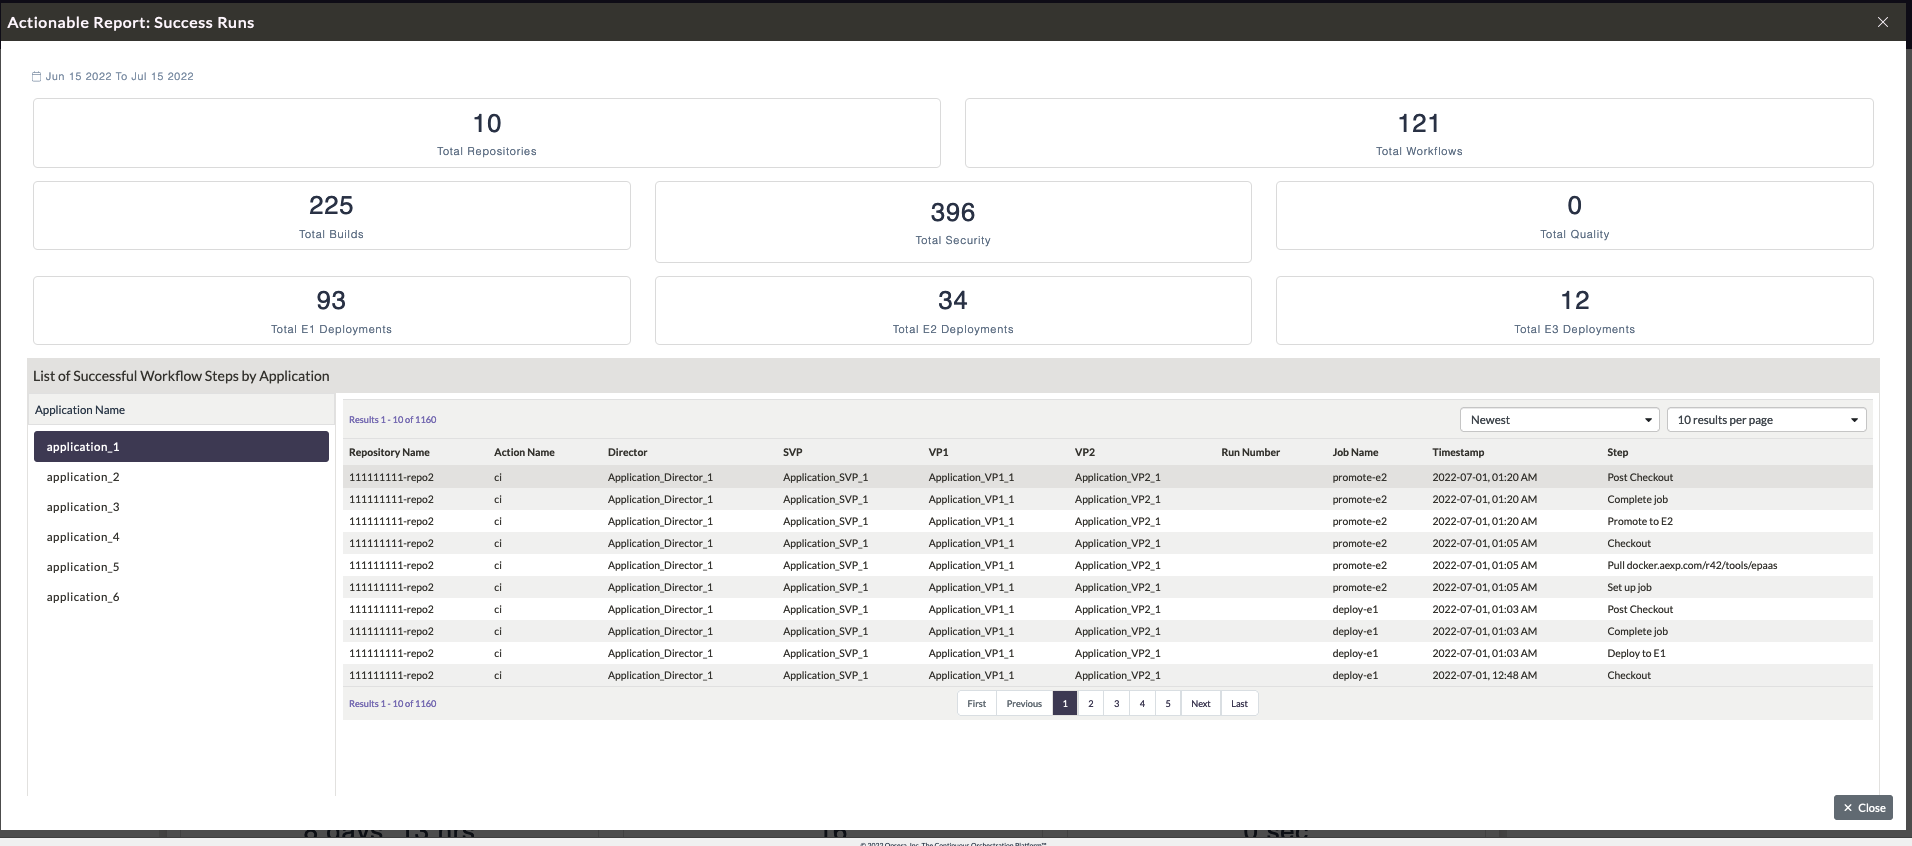
Total Successful Executions : Detailed drill down report on all the successful executions of each workflows, along with a summary that splits the count based on various critical stages in a workflow. The summarized view above shows the total count at various stages, and right below is a table view with a list of application names, and its corresponding list of executions in detail.
Total Failed Executions : Detailed drill down report on all failed executions of each workflows, along with a summary view. The summarized values adheres to the failed counts at all stages of the workflows, followed by a list of applications with its corresponding list of executions and the point of failure. Each workflow execution can be clicked to see the head commit details, in order to trace back to the list of commits made to trigger this workflow action.
This KPI measures the lead time and deployment frequency to production environments along with the time it takes to make the first commit.
The base KPI has 3 data blocks:

Lead Time : The time it takes from code commit to production deployment (E3).
Deployment Frequency : The frequency of daily deployments to production, that happened for a given period of time.
Average time to First commit : The average time it takes to make the first commit to branch once the branch is created.
All three data blocks have the trend icon that depicts the trend compared to the previous results for the same time range selected. It also shows the previous result, providing the capability to compare between two equal time ranges.
Drill Down Report:
This KPI has one page drill down report, next to the KPI settings icon.
The drill down report shows the total number and average of commits, repositories modified, merges, and deployments that happened.
A full view KPI for Developer/Team productivity.

The Base KPI has 3 data blocks :
Total Commits : Total number of commits made by developers within a selected time range.
Total Pull Requests : Total number of PRs raised by developers within a selected time range.
Merged Pull Requests : Total number of PRs that have been approved and merged within a selected time range.
Approved PRs by Project : A pie chart that splits and shows the number of PRs by project that have been approved.
Active Contributors by Total Merges : A bar chart depicting the top 5 active contributors who have been actively raising PRs for their changes.
Declined Pull Requests by Project : Pie chart sliced by project to show the total number of PRs that have been declined by reviewers.
Each slices in the pie chart can be clicked to see the details of the PRs.
This KPI has a drill down report that shows the list of Open/Closed PRs by Application along with the list of contributors for each application.

List of Pending Merge requests by application, to be able to see list of PRs that are yet to be processed. The list provides details on timestamp the PR was created at, branch to which the PR has been raised, title, author and reviewer if it’s assigned to someone.

This KPI provides the list of PRs that have been merged recently.
Select by Repository name, the list appears with details on each PR that has been processed.

A leaderboard KPI to compare between Projects/Applications, to measure the activity based on commits in each repository through filters/tags/date ranges.
